Maven Analytics Toys Challenge
This dashboard was developed and designed as part of #maventoyschallenge. Maven analytics provided sales & inventory data from Maven Toys, "a fictitious chain of small toy stores in Mexico".
About the dataset
dataset of Maven Toys contains 4 tables, in CSV format:
- The Products table contains the 35 products sold at Maven Toys (each record represents one product), with fields containing details about the product category, cost, and retail price
- The Stores table contains the 50 Maven Toys store locations (each record represents one store), with fields containing details about the store location, type, and date it opened
- The Sales table contains the units sold in over 800,000 sales transactions from January 2017 to October 2018 (each record represents the purchase of a specific product at a specific store on a specific date)
- The Inventory table contains over 1,500 records that represent the stock on hand of each product in each store at the current point in time (Oct 1, 2018)
Files
You can download the dataset from here
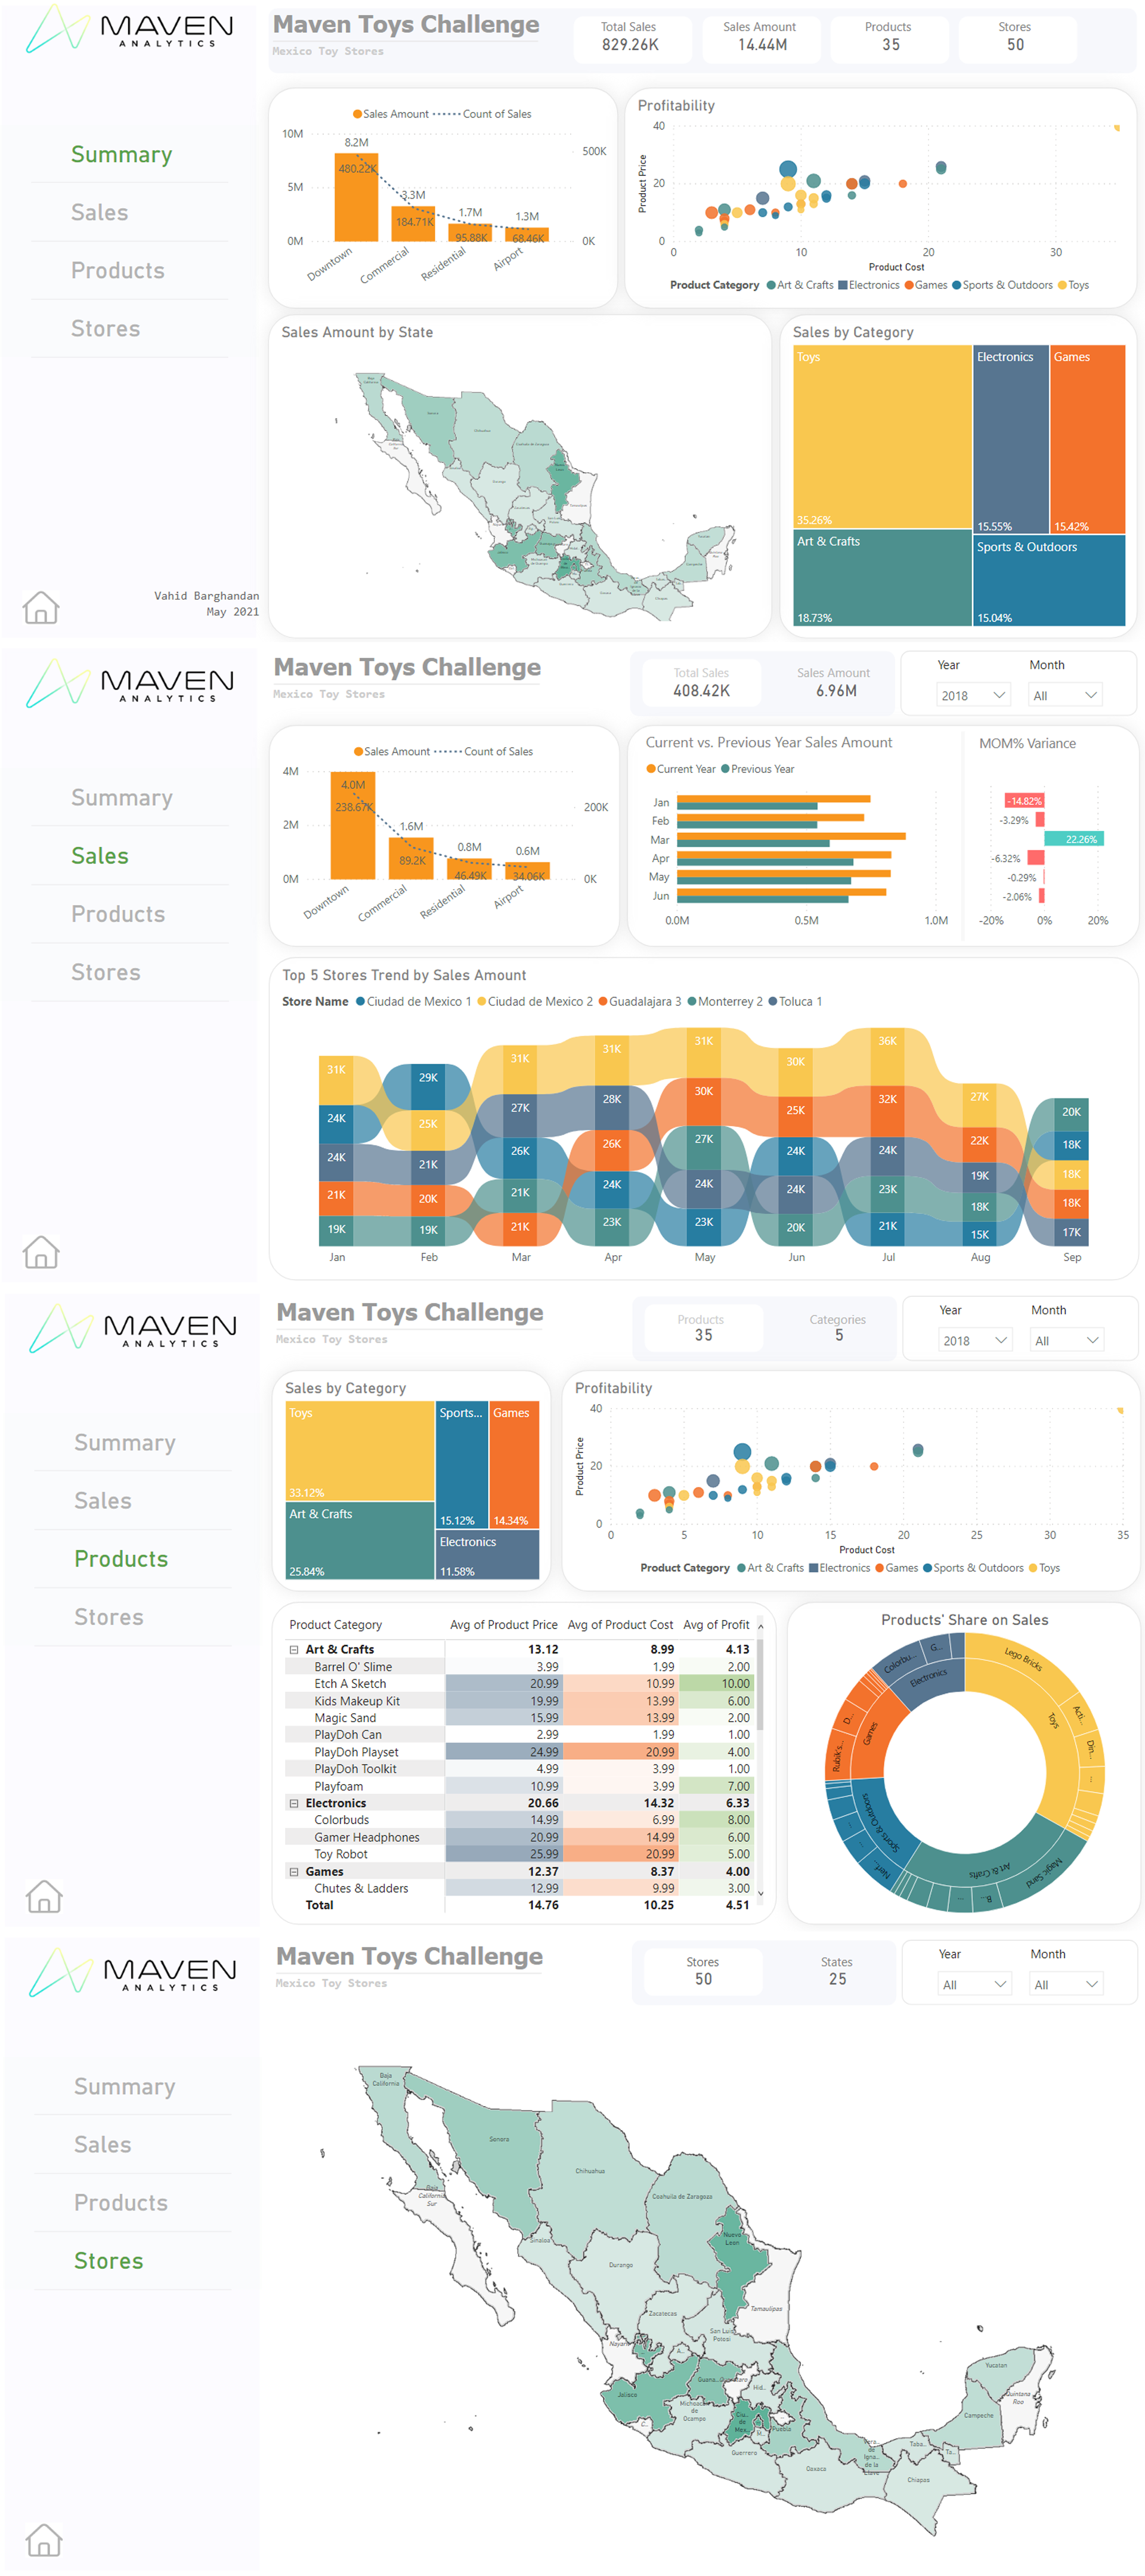
Dashboard
Below is an image of the multi page dashboard I designed for the mentioned challenge.